
![Internet of Things (IoT) by Wilgengebroed [on Flickr, CC-BY-2.0, via Wikimedia Commons]; see : http://commons.wikimedia.org/wiki/File:Internet_of_Things.jpg](/img/blog/2014/12/Internet_of_Things.jpg "IoT by Wilgengebroed [on Flickr, CC-BY-2.0, via Wikimedia Commons]") In the Internet of Things (IoT), the things can be many different devices; typically based on uniquely identifiable embedded computers/processors that are not directly operated by people. Interconnected over the existing internet infrastructure, these things will push automation further in almost every domain. Communicating with people and amongst each other; they will aid monitoring and decision making processes. When possible/desirable they may even make autonomous decisions based on predetermined rules or even self learning algorithms.
In the Internet of Things (IoT), the things can be many different devices; typically based on uniquely identifiable embedded computers/processors that are not directly operated by people. Interconnected over the existing internet infrastructure, these things will push automation further in almost every domain. Communicating with people and amongst each other; they will aid monitoring and decision making processes. When possible/desirable they may even make autonomous decisions based on predetermined rules or even self learning algorithms.It is also clear that the IoT will generate lots of data, as many things will have one or more sensors telling us something about their environment. Like temperature, humidity, running speed of some machine/process, a gas flow rate, or the remaining level of liquid in a tank.
 ThingSpeak
ThingSpeak is an application platform for the Internet of Things, allowing the construction of an application around data collected by sensors. Features include: (near) real-time data collection, data processing, visualizations, apps, and plugins. There are other such platforms, such as Xively (formerly Cosm), Beebotte, and Open.Sen.Se; each platform probably providing different pros and cons.You could of course also Do It Yourself (DIY) using Google App Engine (GAE), Amazon Web Services (AWS), or Microsoft Azure to build some web services that take in sensor data, store it, visualize it, and/or act upon this data. However, the dedicated IoT platforms provide several features that may take some time to develop; and there is nothing wrong with mixing and matching.
In fact, as the ThingSpeak API is open source (available on GitHub), you can run the data collection locally and if needed modify (parts of) it to your needs. This allows for aggregation and/or processing of data before submitting it on the big bad internet, or keeping all of the data in your own Local or Wide Area Network (LAN/WAN).
Public and/or Private Channels
At the heart of ThinkSpeak are channels, a channel is where you send your (sensor) data to be stored. Each channel allows for submitting entries consisting of up to 8 data fields (both numeric and alphanumeric formats), location information, and a status update. Each entry is stored with a date and time stamp and is assigned a unique identifier.
To read and write to a channel, your device/application must make requests to the ThingSpeak API using HTTP requests. Each channel also has different API keys for reading and writing, allowing the sensor/device to just know how to submit data, but keep it in the dark on how to read from the channel. Which is useful, as the IoT things you deploy might get compromised; and if that does happen, you can generate a new key (invalidating the lost key).
 Example: Process Monitoring
While I have an Arduino, I currently don't have a network shield to connect it independently to the internet. Via a host computer would be possible, but for my first experiment I decided to make things even simpler: just monitor whether specific user processes are running on a computer.
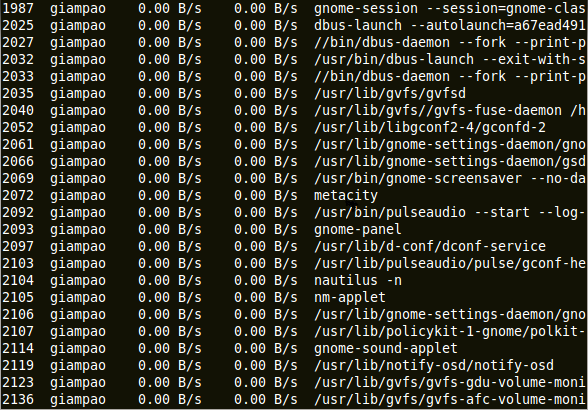
So I created a Python script to see if certain processes are running on a laptop. It connects to a ThingSpeak channel with a Write API key, then iterates over all processes (using the psutil library) to see whether certain criteria are matched; reporting its findings by submitting an entry into the channel. Finally, the script would sleep a while before checking again.
Each entry has one field per process, set to one (1) when that watched process was running and zero (0) if not.
I considered keeping track of how long a process was running (and perhaps could get this from psutil already) and reduce reporting. However, just always reporting also helps detecting whether the laptop is running or not. The lack of entries at certain times would show that the computer was off or sleeping. While entries with all zeros would still mean something: the computer was on at that time, but none of the watched processes was running.
Each entry has one field per process, set to one (1) when that watched process was running and zero (0) if not.
I considered keeping track of how long a process was running (and perhaps could get this from psutil already) and reduce reporting. However, just always reporting also helps detecting whether the laptop is running or not. The lack of entries at certain times would show that the computer was off or sleeping. While entries with all zeros would still mean something: the computer was on at that time, but none of the watched processes was running.
Running Script as Daemon
To make the script run as a daemon process is possible with Python; there are some libraries that should make it relatively straightforward. But I decided to use supervisord instead, as the monitoring would take place on a Linux system anyway, namely Xubuntu. Once installed this Supervisor is easy to configure while the Python script could remain straightforward (read: no distraction from its main purpose). On a Windows machine, consider using FireDaemon or NSSM to run scripts as background services.
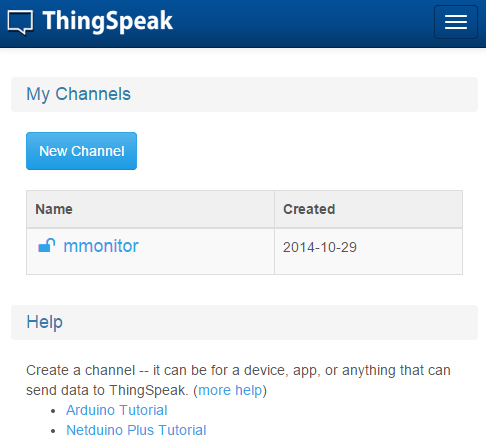
You will need an account on ThingSpeak.com to create and configure a channel, which you can make public for anyone to view its feed and charts. A numeric identifier will be assigned to the channel, which becomes part of the URL that you can share.
Other channel settings allow you to provide a name, description, metadata / tags, default channel location information (latitude, longitude, and elevation) and some URLs for background information and/or usage videos. You can also provide names for the data fields, which will help in configuring charts.
The documentation indicates that it is possible to create/configure channels and views through the API as well. I didn't try this in my experiments so far, but I can imagine this as very useful for companies that would deploy many similar devices and need some way to automate the linking of these things to channels. Adding some metadata/tag inside the channel to know which device it represents and pre-populating a Write API key inside the device itself, so that it can start recording as soon as it is deployed (and connected).
 Configuring the Channel
You will need an account on ThingSpeak.com to create and configure a channel, which you can make public for anyone to view its feed and charts. A numeric identifier will be assigned to the channel, which becomes part of the URL that you can share.Other channel settings allow you to provide a name, description, metadata / tags, default channel location information (latitude, longitude, and elevation) and some URLs for background information and/or usage videos. You can also provide names for the data fields, which will help in configuring charts.
The documentation indicates that it is possible to create/configure channels and views through the API as well. I didn't try this in my experiments so far, but I can imagine this as very useful for companies that would deploy many similar devices and need some way to automate the linking of these things to channels. Adding some metadata/tag inside the channel to know which device it represents and pre-populating a Write API key inside the device itself, so that it can start recording as soon as it is deployed (and connected).
 Read/Write API Keys
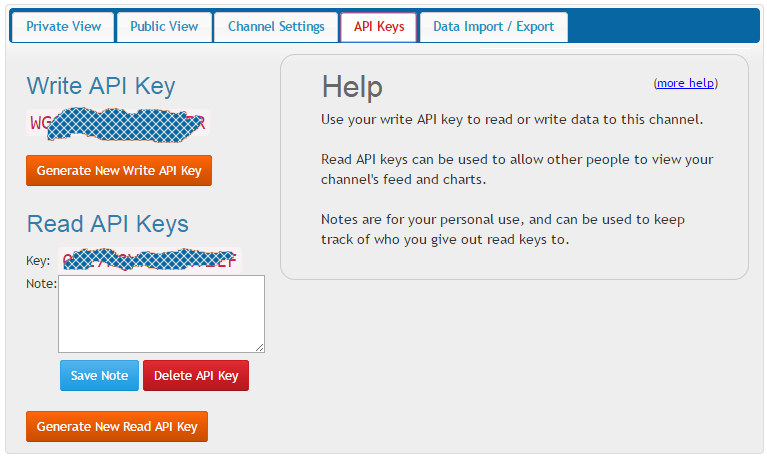
Per channel there is just one Write API key, for the device or application that submits data entries into the channel.
For getting data and viewing it on-line you can assign Read API keys. While public channels don't need a Read key, private channels may want more than one to provide read access to specific users and/or processes.
 Channel Views
Each channel has a private view and a public view to interact with the data collected, you can have different info on each view, customize them with plugins, and even disable the public view.
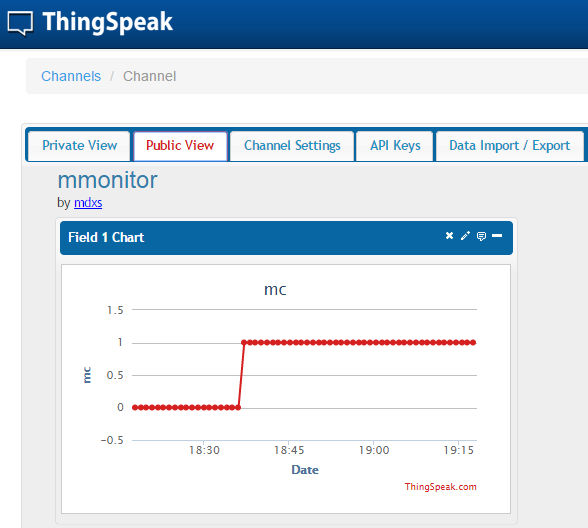
The line chart here shows the last 60 data points of Field 1: when the "mc" process was last seen running or not. Using line charts for this on/off type of data on a time axis has its limitations, as I will show below when discussing the plugin.
Charts
Customizing the charts on a ThingSpeak view is possible: per field you can provide title, axis information, colours, type (line, bar, column, or spline), whether it gets dynamic updates, range of values (in days or number of results to retrieve), grouping / averaging / summing per time slice, rounding and min/max values (for data and for the axis).
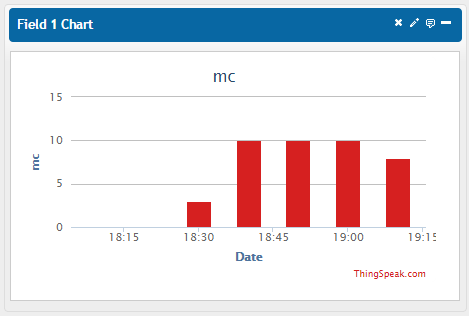 This column chart for example is showing the same Field 1 data, but now summed per 10 minute interval. As the recording is per minute, ten times a one reported in a 10 minute interval means that the process has been running the whole time. The left and right bars show that in those intervals the process was started or stopped; as it only has seen been running for a fraction of the 10 minute interval.
Now, the view allows a chart per field, but what if you want to combine some fields into one chart? I want to see for example when the "mc" process was running next to another process.
Plugins
Enter plugins, which can be created based on some templates (default, Google Gauge, or a Chart with Multiple Series) allowing custom HTML, JavaScript and CSS to parse and display the data. When completed, these plugins can be shown on the private and/or public views of a channel.
Based on the multiple series template, I combined the different fields into the following line chart initially. Note that you only see data for one field/process; as during this sample the other processes were never running.

It does show however a different kind of problem: lines are not a good representation of this on/off data collected over time; with gaps where the laptop was turned off or sleeping. The lines thus connect points which might not be connected; this is most clear from the diagonal lines but might actually be worse elsewhere...
Compare the above with the following, column style chart, with the same data:

This shows more accurately when the "mc" process was running, namely during the red blocks in the chart. Hovering over the start- and end-points of these blocks will show the exact times when the process was running.