
With the ThingSpeak API you can also download the collected data for further processing. I’ve used this to extract timeline data; mainly for visualization purposes. Though it would also allow for storing (summary) data into a database of sorts, or perhaps even into another channel.
Introduction
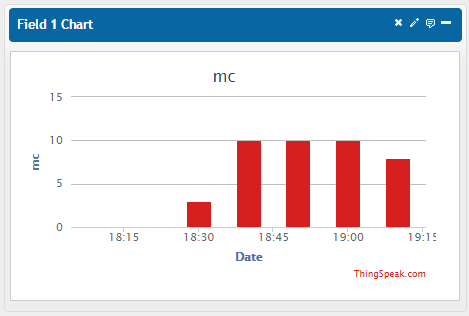
In this article, I will use the ThingSpeak channel data from the Process Monitoring example as described in my previous article on "Data Collection using ThingSpeak"). Using a daemon/service that reports every minute into the channel whether it sees some watched processes running on a laptop or not.Because the laptop can be closed/sleeping or turned off, there will be time gaps in the data collected. This was visible in the column style chart presented at the end of my previous post:

Get the Channel Feed
The entries in the ThingSpeak channel can be obtained using the feeds API; in CSV, JSON, or XML formats. You will need to provide a Read API key when the channel is private; for public channels this is optional.
There are several parameters to get (aggregated) results from the feed/channel. For the free ThingSpeak.com hosted channels, there is a 8,000 entries maximum per request; and a caching policy applies for requests that get more than 100 records. So check the API and the rate limits when you want to produce near real-time applications. They seem very reasonable limits to me; and if you want/need more you can always host your own instance of the server.
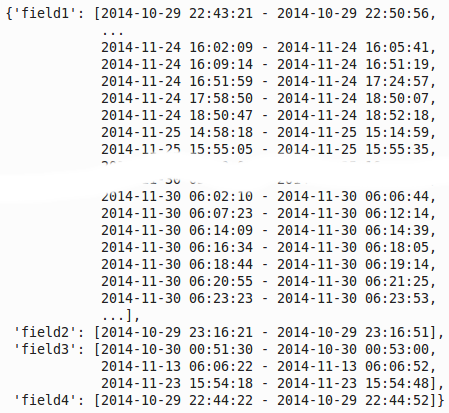 |
| Timeline records (extracted from raw data) |
I combine those raw data records that are close enough in time (based on data collection interval plus a small offset) into timeline records with a start- and stop time. Each such timeline record thus represents a run of a process, covering one or more raw data records. This is done for each watched process, as they run independently of each other.
A special case is the computer/device own run timeline records, which are determined from all the raw data records. Since the computer must have been running to collect data... whether or not a watched process was running.
Visualization
Then the Python script generates a HTML file with the extracted timeline records shown in a vis.js based timeline, grouped per watched process. For the 8,000 raw data entries, some 400 timeline records where output (not all shown here).
The following Timeline matches the column style chart above on date/time:
 But the vis.js based timeline allows zooming in on details more easily, for example on just one day:

The following Timeline matches the column style chart above on date/time:
Summary
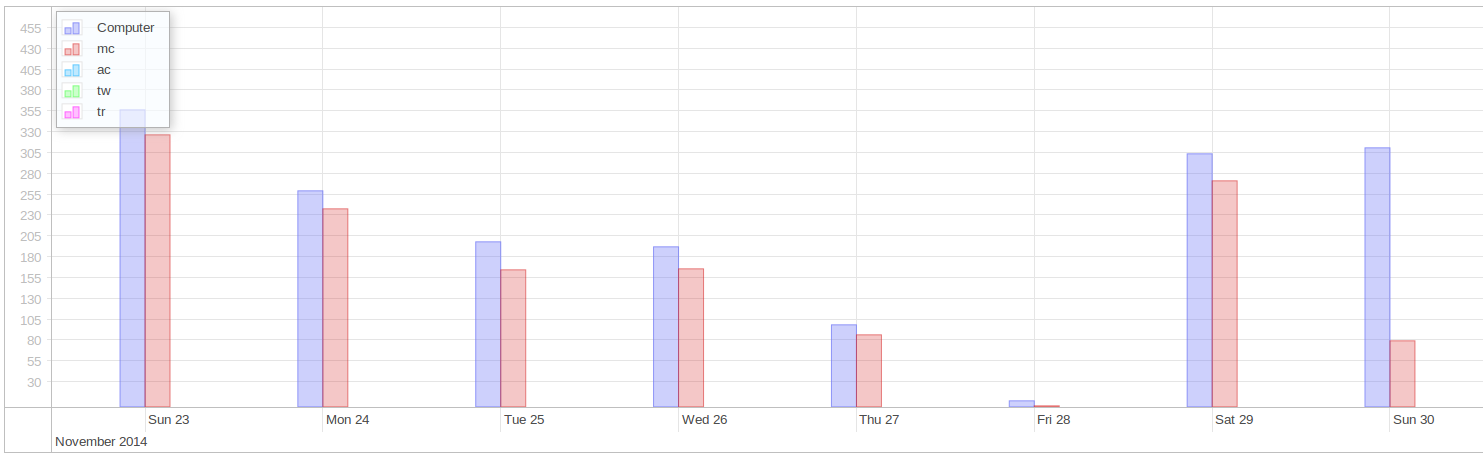
The data can be further reduced: summarizing per day how much time the device and the watched processes have been running. Which can be visualized using a graph2d chart of the vis.js library: